Bitcoin Price Analysis: BTC Continues Consolidation, Here are
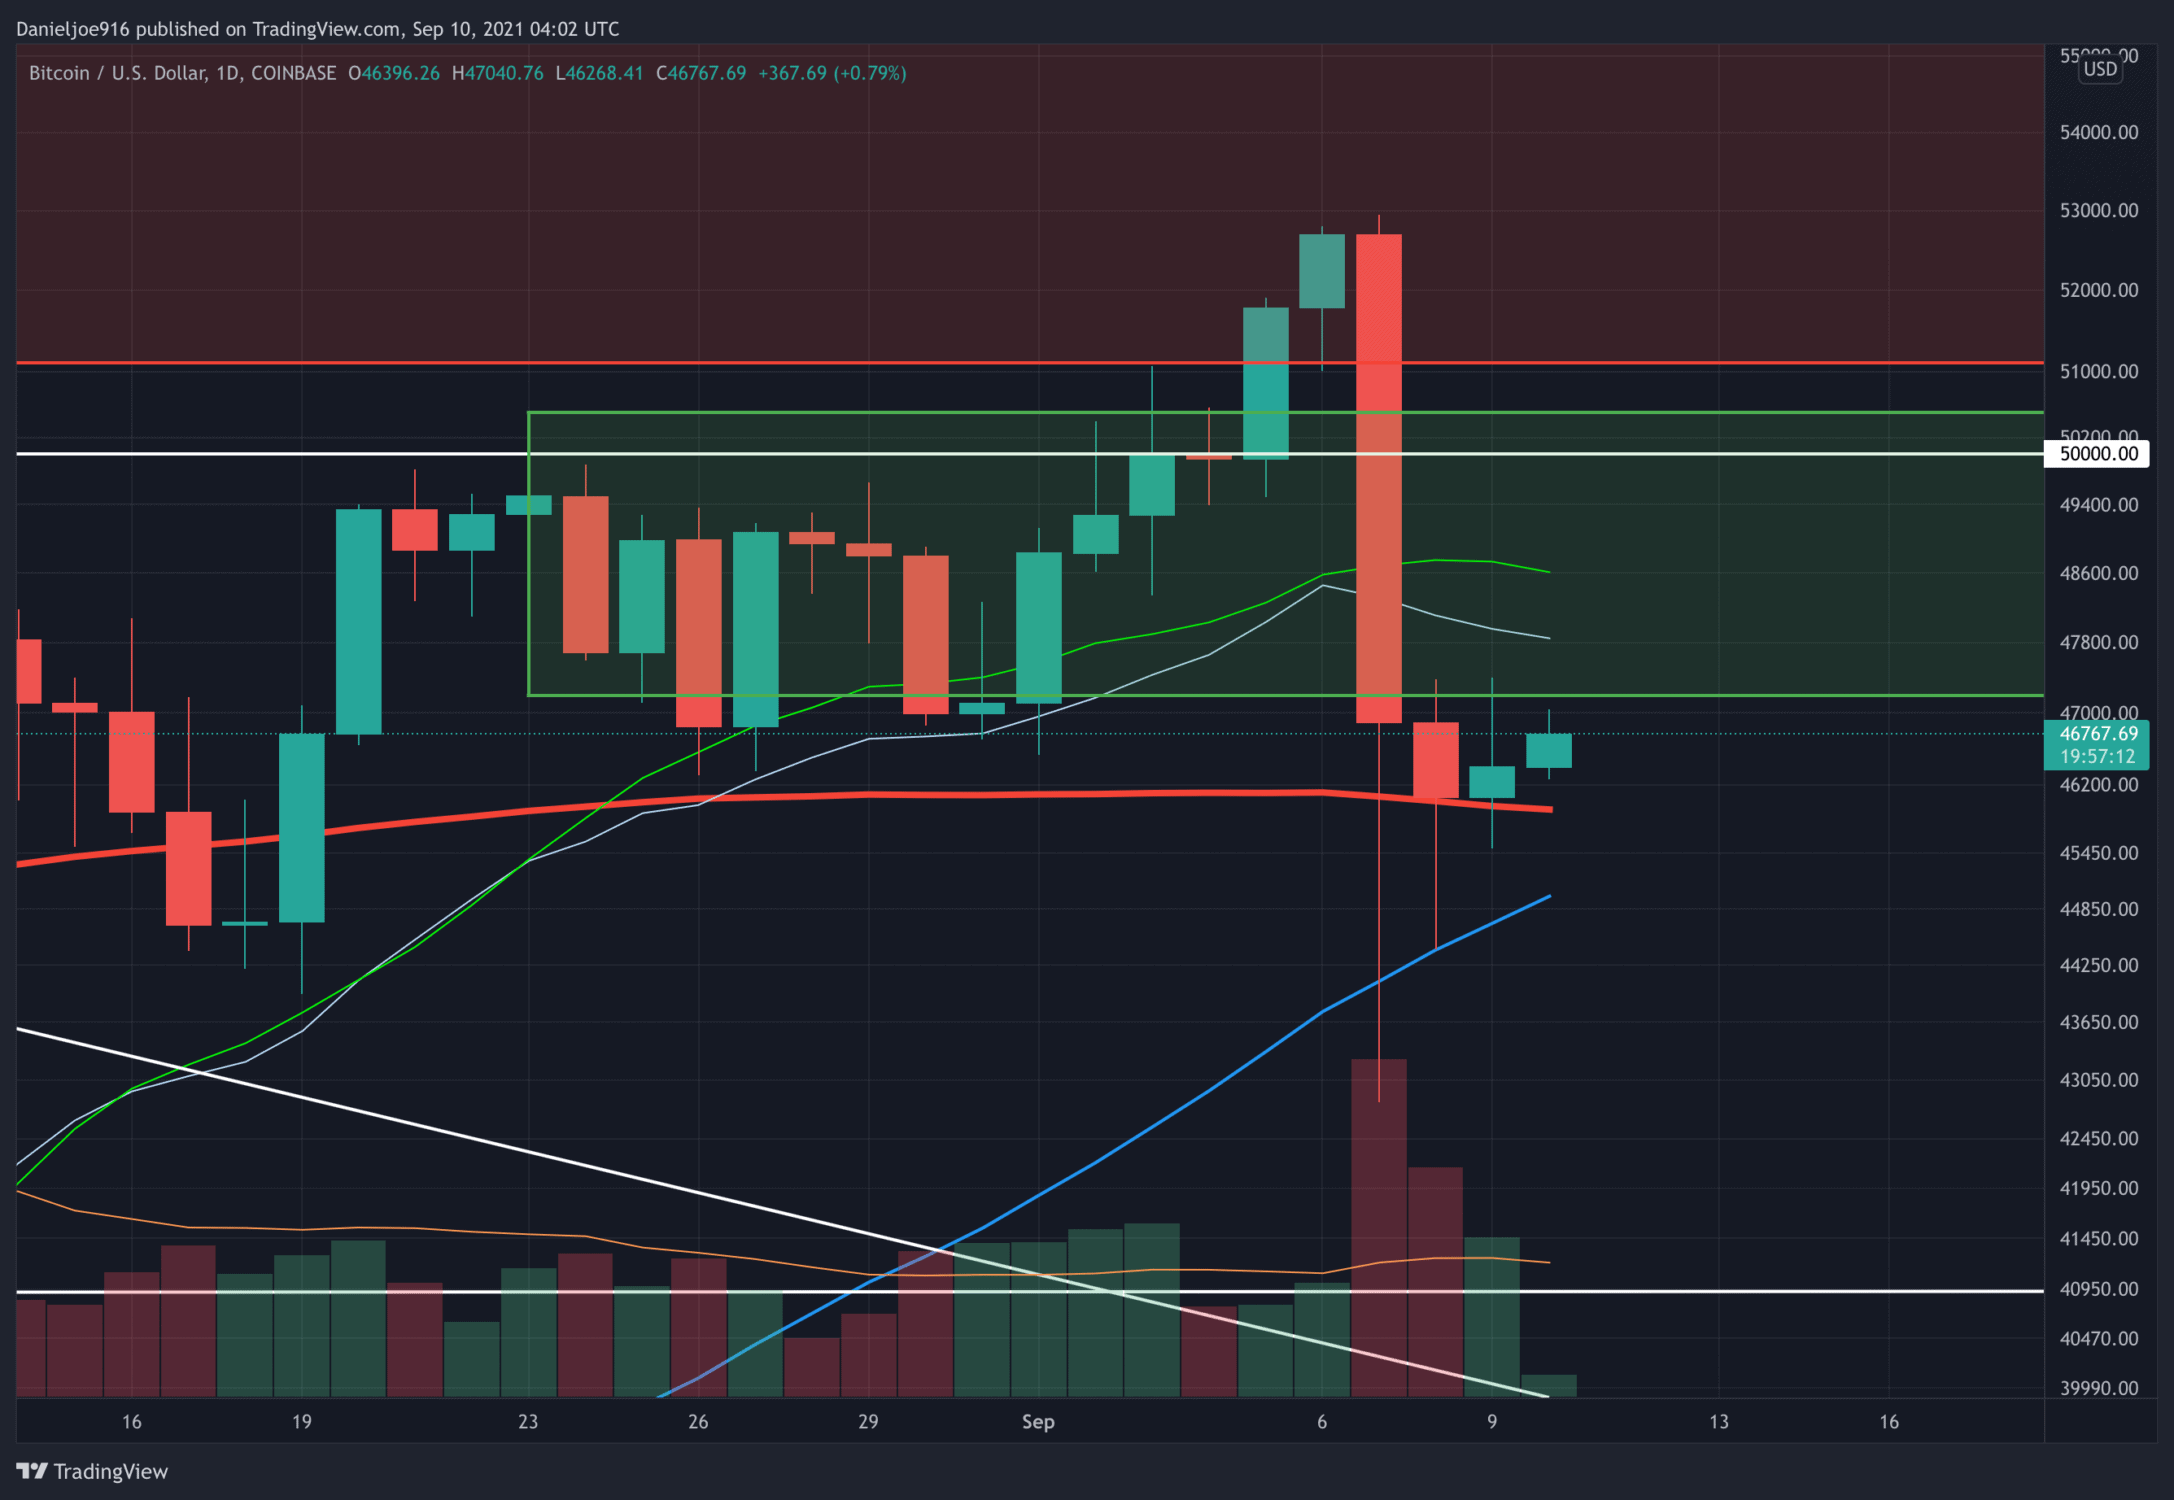
Once again, BTC held support at the critical 200-day moving average of around $46k after shaking another round of weak hands. Although the near term charts look bearish, the overall trend in fundamental, technical, and on-chain data remain firmly bullish, indicating Bitcoin will likely head higher in the next few months.
BTC Falls While Strong Hands Continue to Buy
Spot exchange reserves printed another multi-year low, further indicating strong accumulation, especially with long-term holders and entities with a low history of selling. Total spot exchange net flows came in at nearly -3000 BTC with total spot inflows of 9,858 BTC and total spot inflows of 12,788 BTC.
Looking at BTC miners, on-chain metrics show a return to accumulation after minimal selling during the liquidation event. Total miner outflows to exchanges to sell have fallen significantly while miner reserves have been increasing.
CryptoQuant’s UTXO Age Distribution metric showed that coins older than 12 months continued to hold while the same 3 to 6-month cohort panic sold again. This metric, along with many other on-chain metrics, continues to invalidate the bear thesis calling for a bull trap. Although a bull trap is possible, there are currently no major warning signals on-chain to support the thesis.
For the bears to be validated, long-term holders, large miners, and entities holding large amounts of older coins need to start selling to form a selling trend on-chain. The data continues to favor the bulls, firmly suggesting this is a shakeout on the way to higher prices in the next few months.
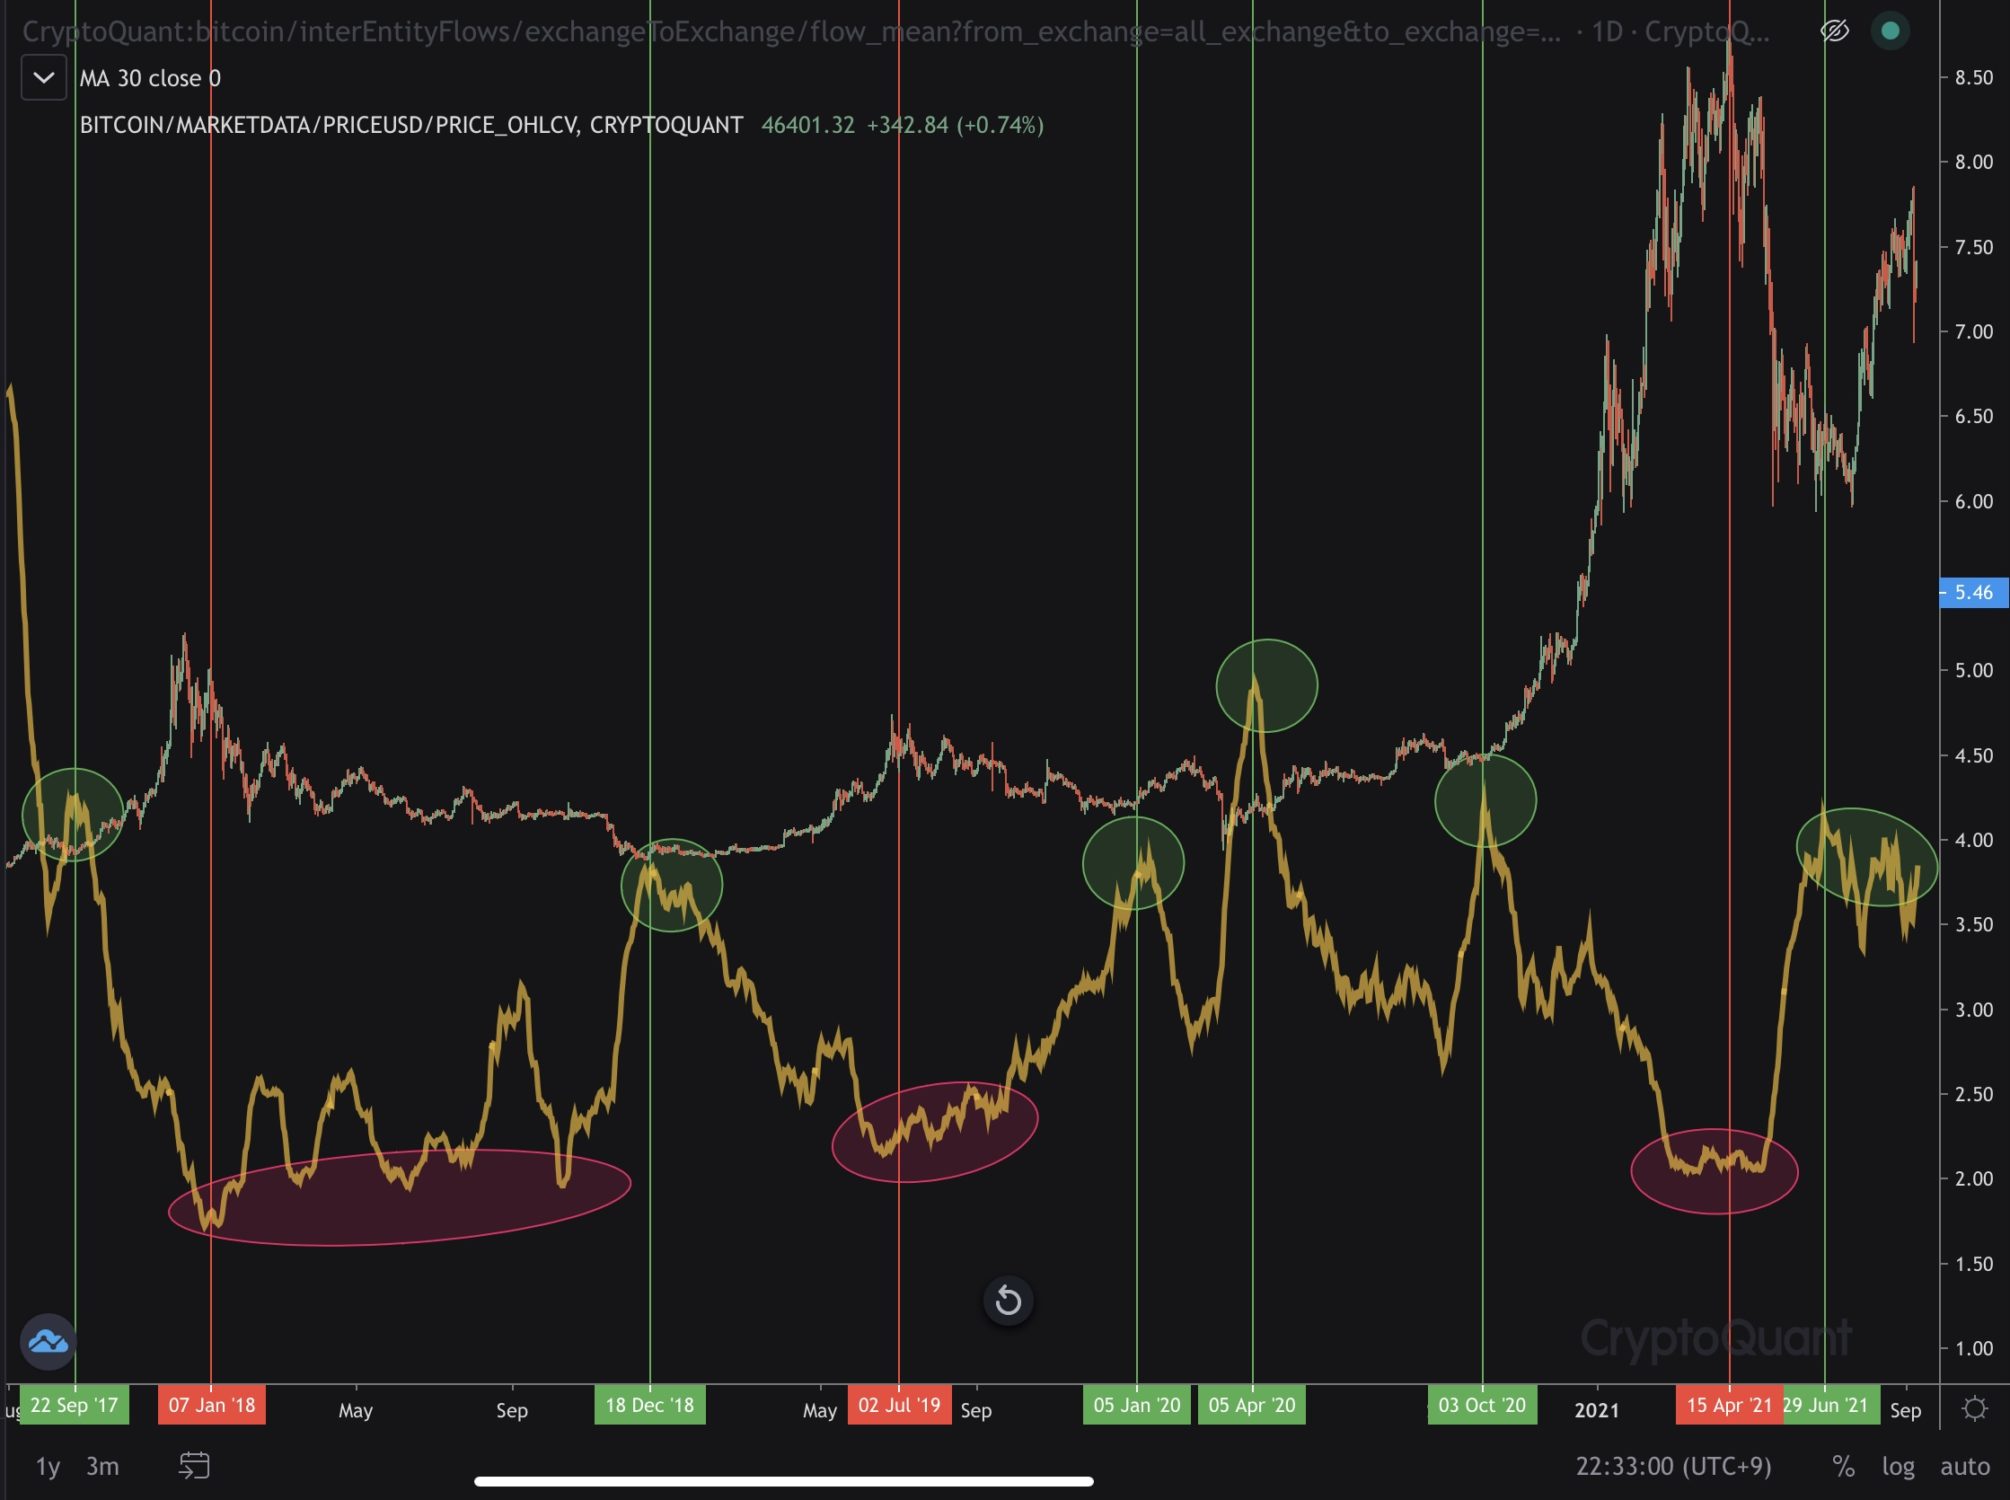
Over the past few months, on-chain data has been showing a trend of whales sending BTC to derivative exchanges, likely to build positions or fill up on margin. CryptoQuant CEO Ki Young Ju posted a chart showing All Exchange to Derivative Exchanges Flow Mean using a 30-day moving average. Ki points out when the 30-day moving average of the BTC flow mean pushes higher, this has historically led to significant rallies in BTC months later.
Mid-Term Bullish Technical Signal Flashing
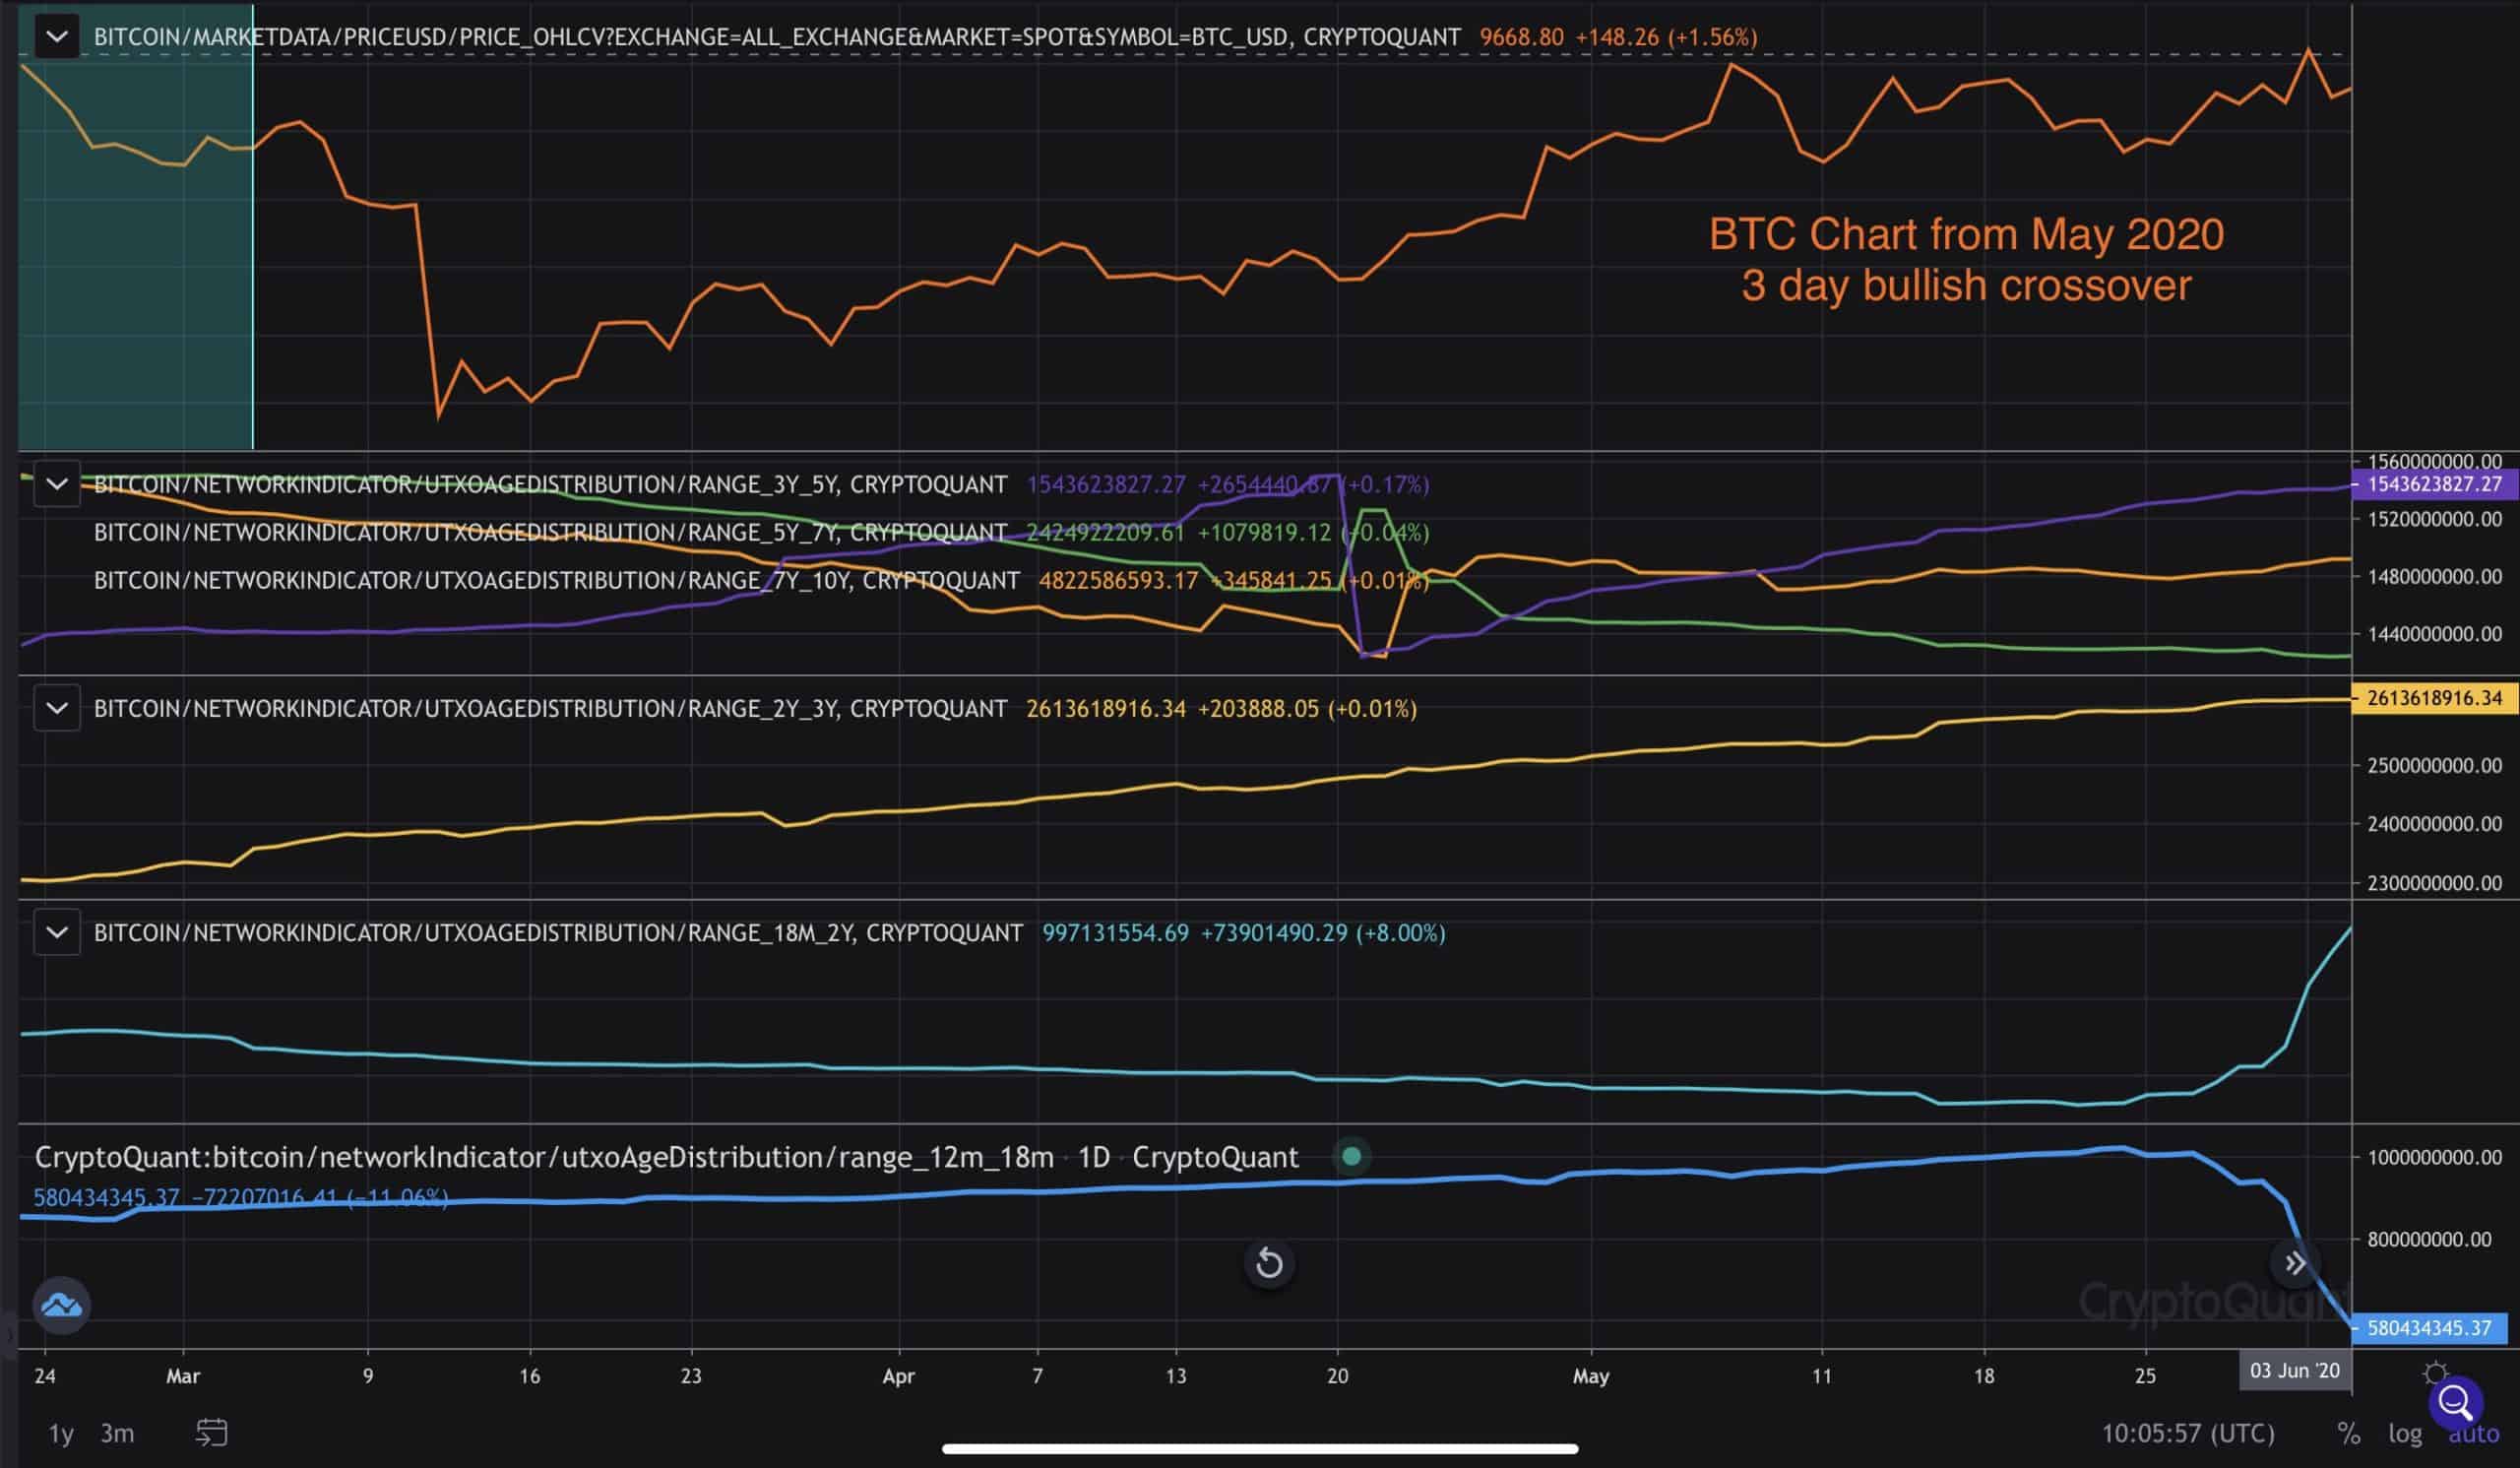
The 3-day chart of BTC is starting to look much better, especially after momentum pushed above neutral and continues to trend higher. As of yesterday, the 21-day moving average crossed above the 50-day moving average on the 3-day chart, signaling mid-term strength in momentum and structure.
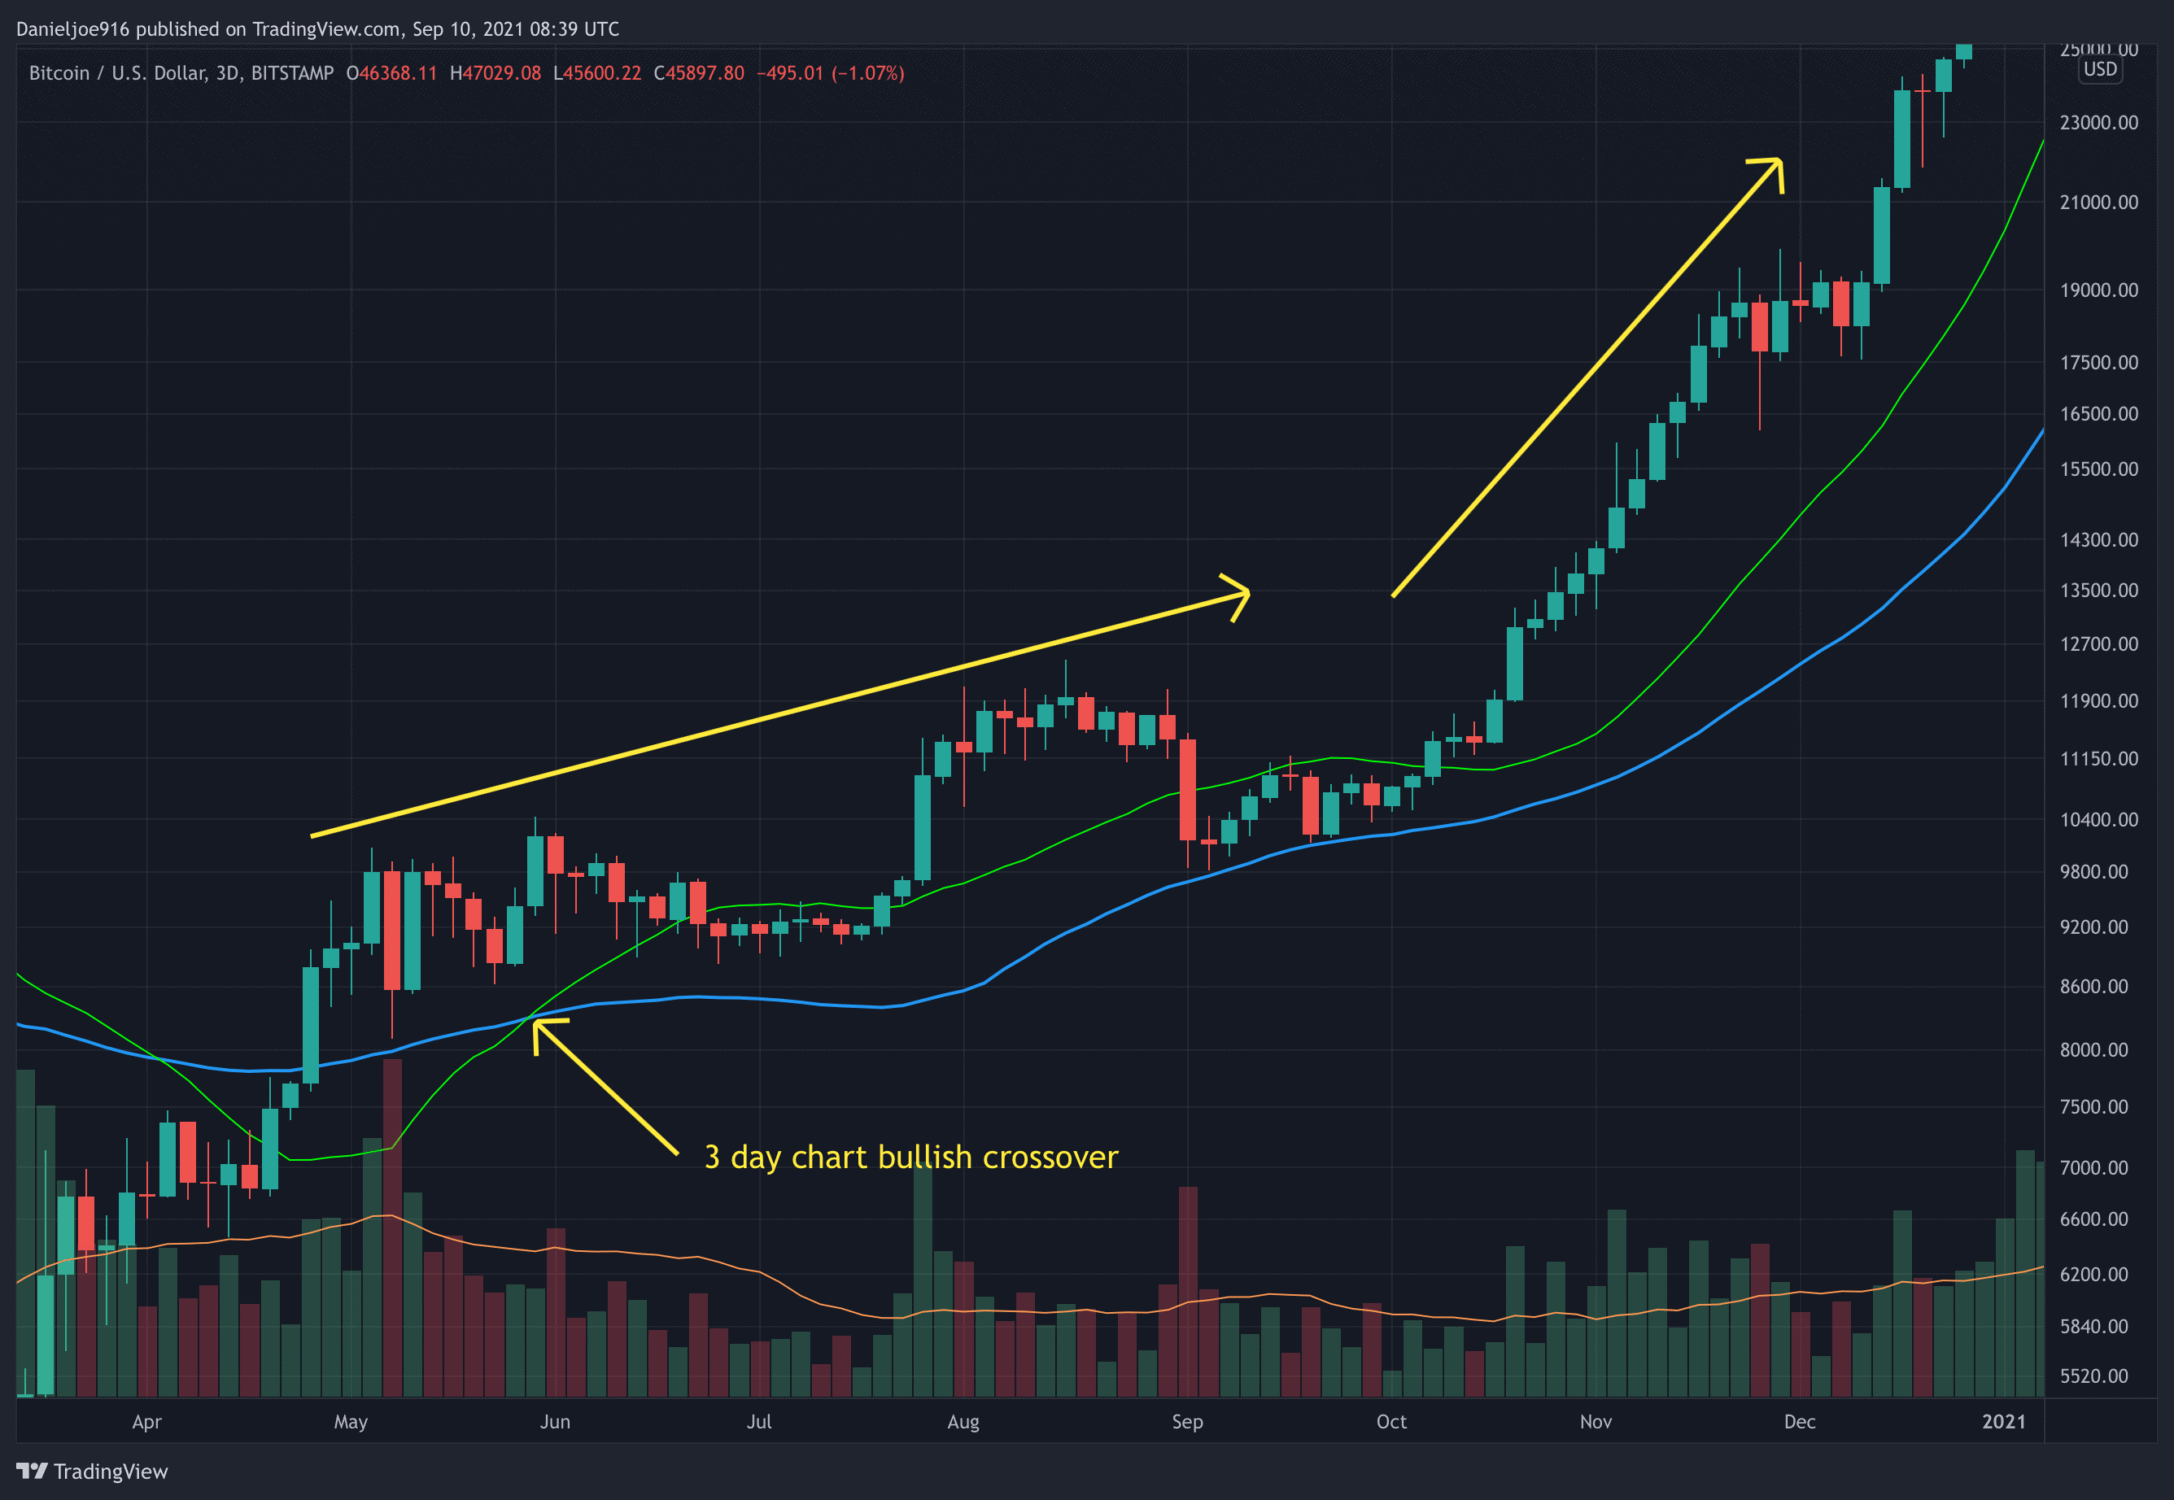
Chart by TradingView
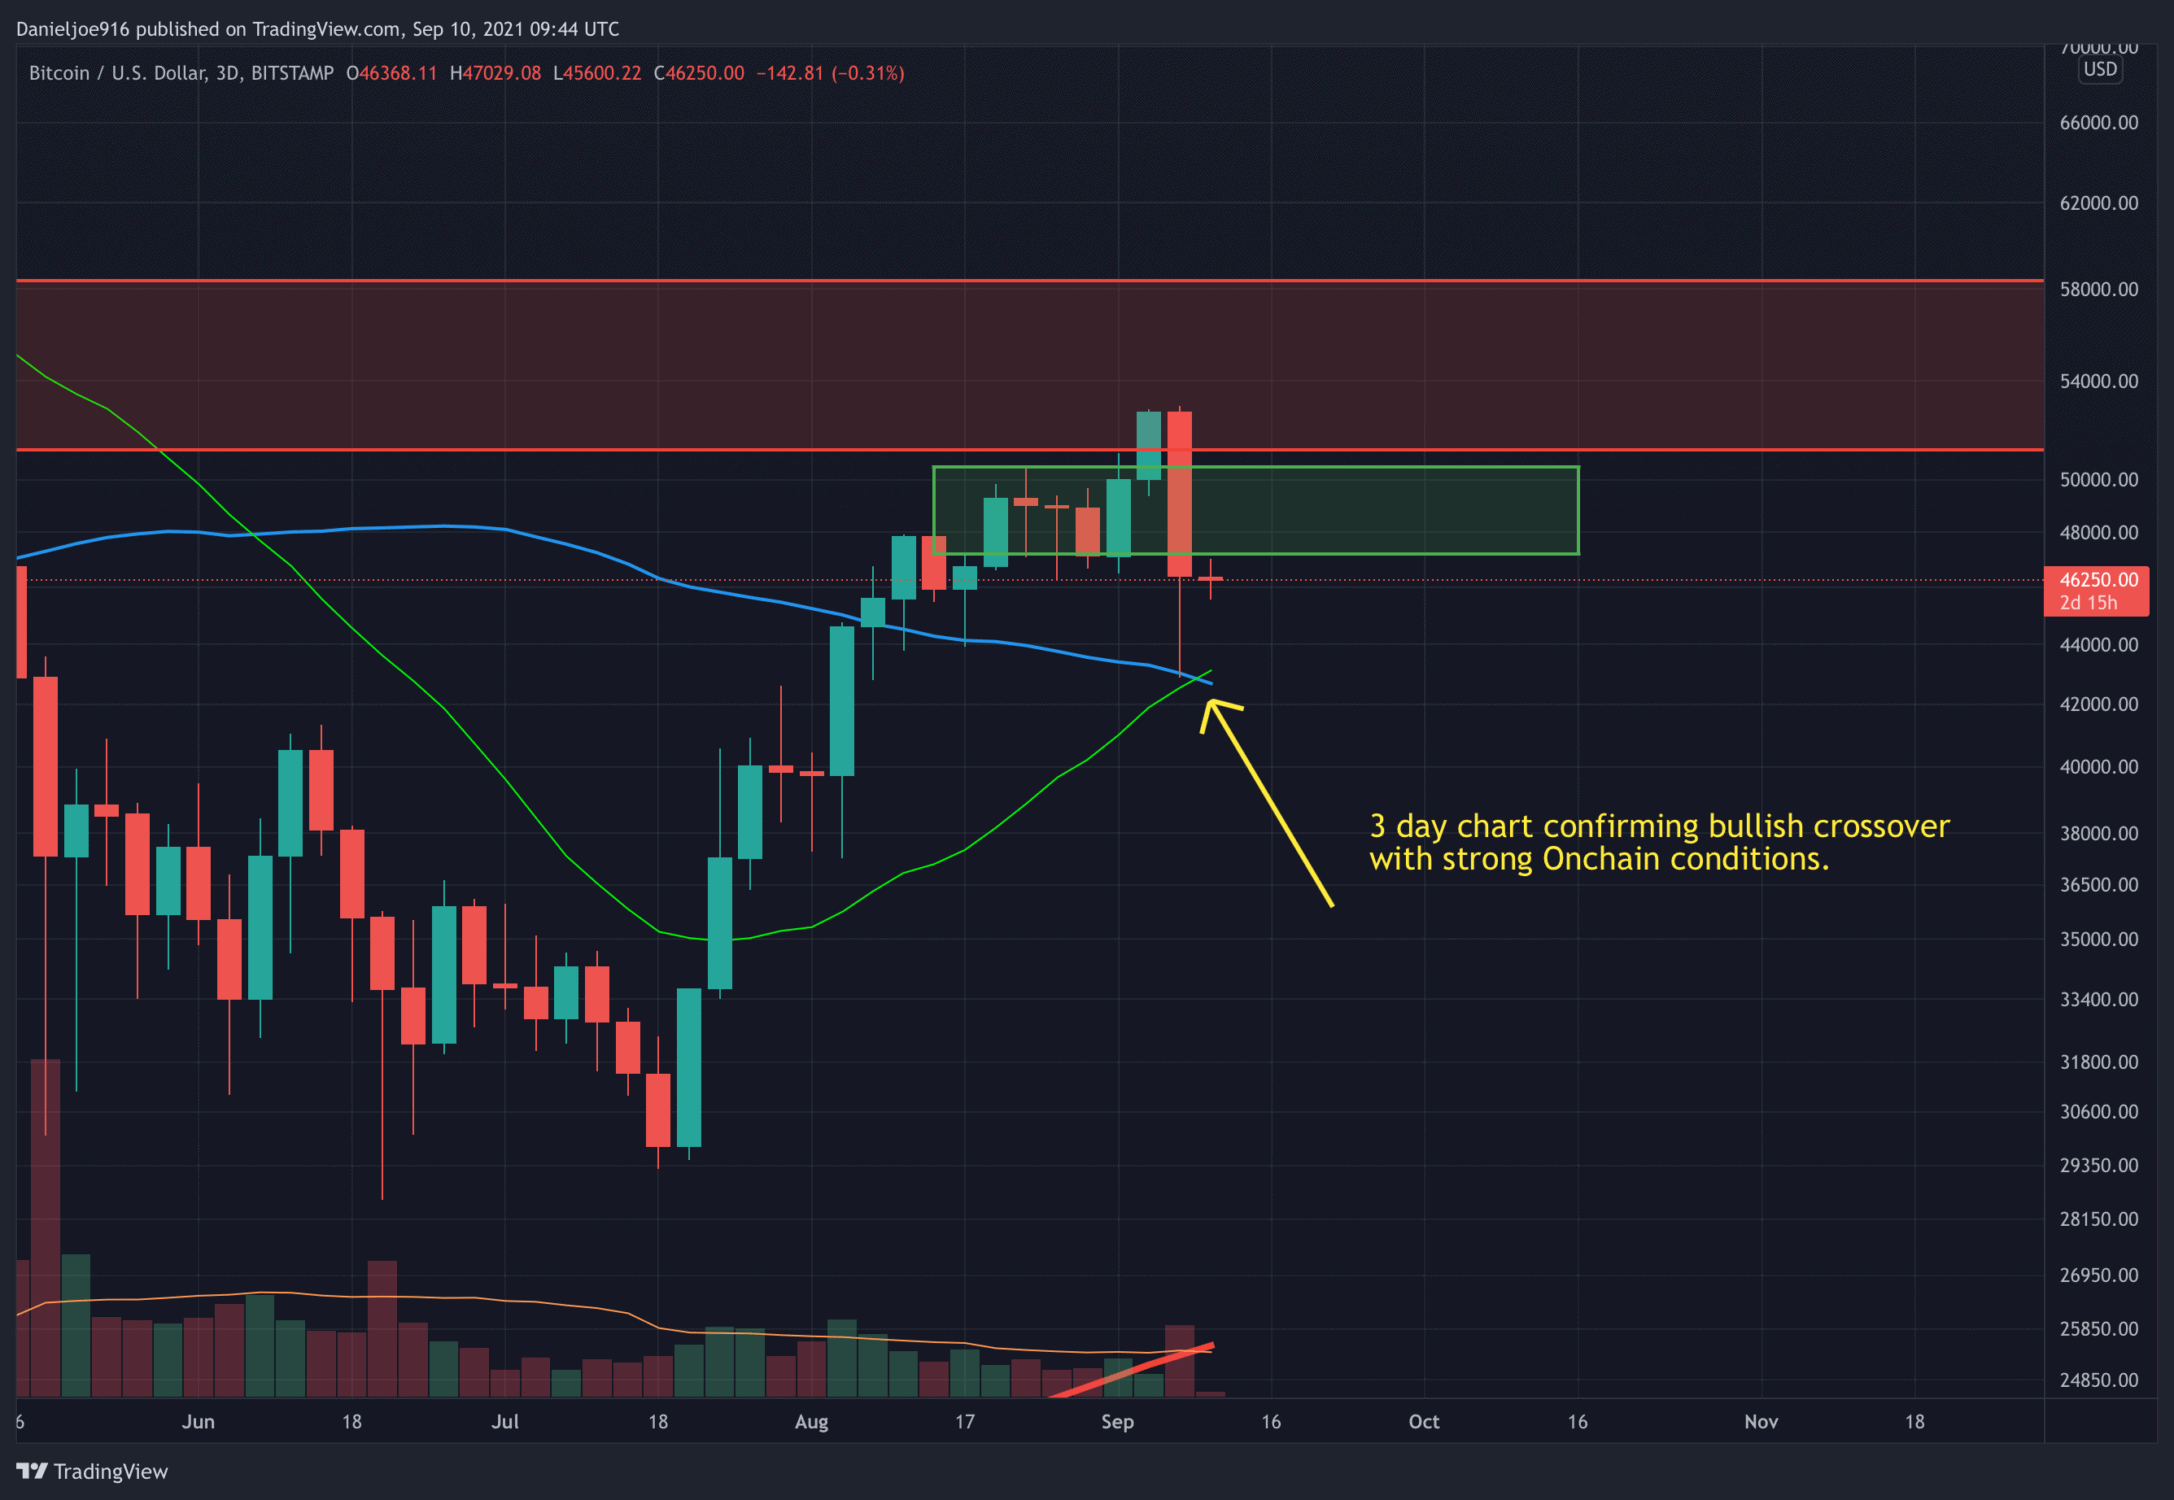
More importantly, the aggregate on-chain data remains strong and continues to show a bullish trend in HODL behavior and accumulation. The current conditions are very similar to May 2020, which was the last time the bullish crossover occurred. In short, cohorts holding older coins were accumulating and holding in May 2020 and are currently showing similar behavior now. This is yet another mid to long-term bullish signal for the largest cryptocurrency. Note, as cohorts age into the next age category, this will cause coinciding moves up and down, such as the 12 to 18 month aging into the 18 months to the 2-year group.

A Key Level to Watch
Near term, it is important to see BTC continue to protect critical support at the 200-day moving average at $46k, and start reclaiming $47.2k, a major level according to the UTXO realized price distribution metric. A close back above $47.2k is a near-term bullish signal and should help boost momentum heading into the weekend, setting up for an attempt to reclaim $50k.
So far, it is good to see long liquidations cooling off, a signal of weakening sell pressure. Considering large holders of older coins are not selling, and near-term momentum on the 4-hour chart is slowly trending higher, it’s possible BTC has found a bottom and will begin the recovery process to reclaim $50k.
The near-term chart may look “scary,” but the overall trend in fundamentals, technicals, and on-chain remain firmly bullish and strong suggests higher prices in the coming weeks and months.